Soft sensing modeling of metatitanic acid particle size based on machine learning
-
摘要: 以某硫酸法钛白生产线的3608条数据为样本,采用皮尔逊系数和统计P值考察了工业钛液的五个属性变量与偏钛酸粒度D50的相关性,并采用LOF算法对数据进行离异值处理以提高数据质量。在此基础上,采用python语言基于Ridge (岭回归)、Lasso (套索回归)、KNN (K-近邻)、ANN (人工神经网络)、Random Forest (随机森林)、SVR (支持向量机)六种模型编写了偏钛酸粒度控制的回归模型算法,六种算法分别应用在整套数据上的回归预测效果差别不大,离异值处理后数据的RMSE都是在0.276上下波动,MAE则是在0.197上下波动,模型效果均优于离异值处理前模型效果。进一步的,通过对ANN、Random Forest、SVR三个模型进行集成学习模型搭建,回归预测效果得到显著提升,RMSE和MAE值分别降至0.245和0.192。Abstract: Taking 3608 data of a titanium dioxide production line by sulfuric acid process as samples, the correlation between the five attribute variables of the industrial titanium sulfate solution and the particle size of metatitanic acid D50 was investigated by Pearson coefficient and statistical p value, and the LOF algorithm was used to clean the outlier data and improve the data quality. On this basis, the regression model algorithm of metatitanic acid particle size control was compiled by Python language based on six models of Ridge, Lasso, KNN, ANN, Random forest and SVR. The regression prediction results of the six algorithms applied to the whole set of data have no significant difference. After the outlier processing, the RMSE and MAE of the data fluctuate around 0.276 and 0.197 respectively, and the model effect is better than that of the model before the outlier processing. Furthermore, through the ensemble learning model of ANN, Random Forest and SVR, the regression prediction effect can be significantly improved, and the RMSE and MAE values decreases to 0.245 and 0.192 respectively.
-
Key words:
- TiO2 /
- metatitanic acid /
- particle size /
- soft sensing /
- machine learning
-

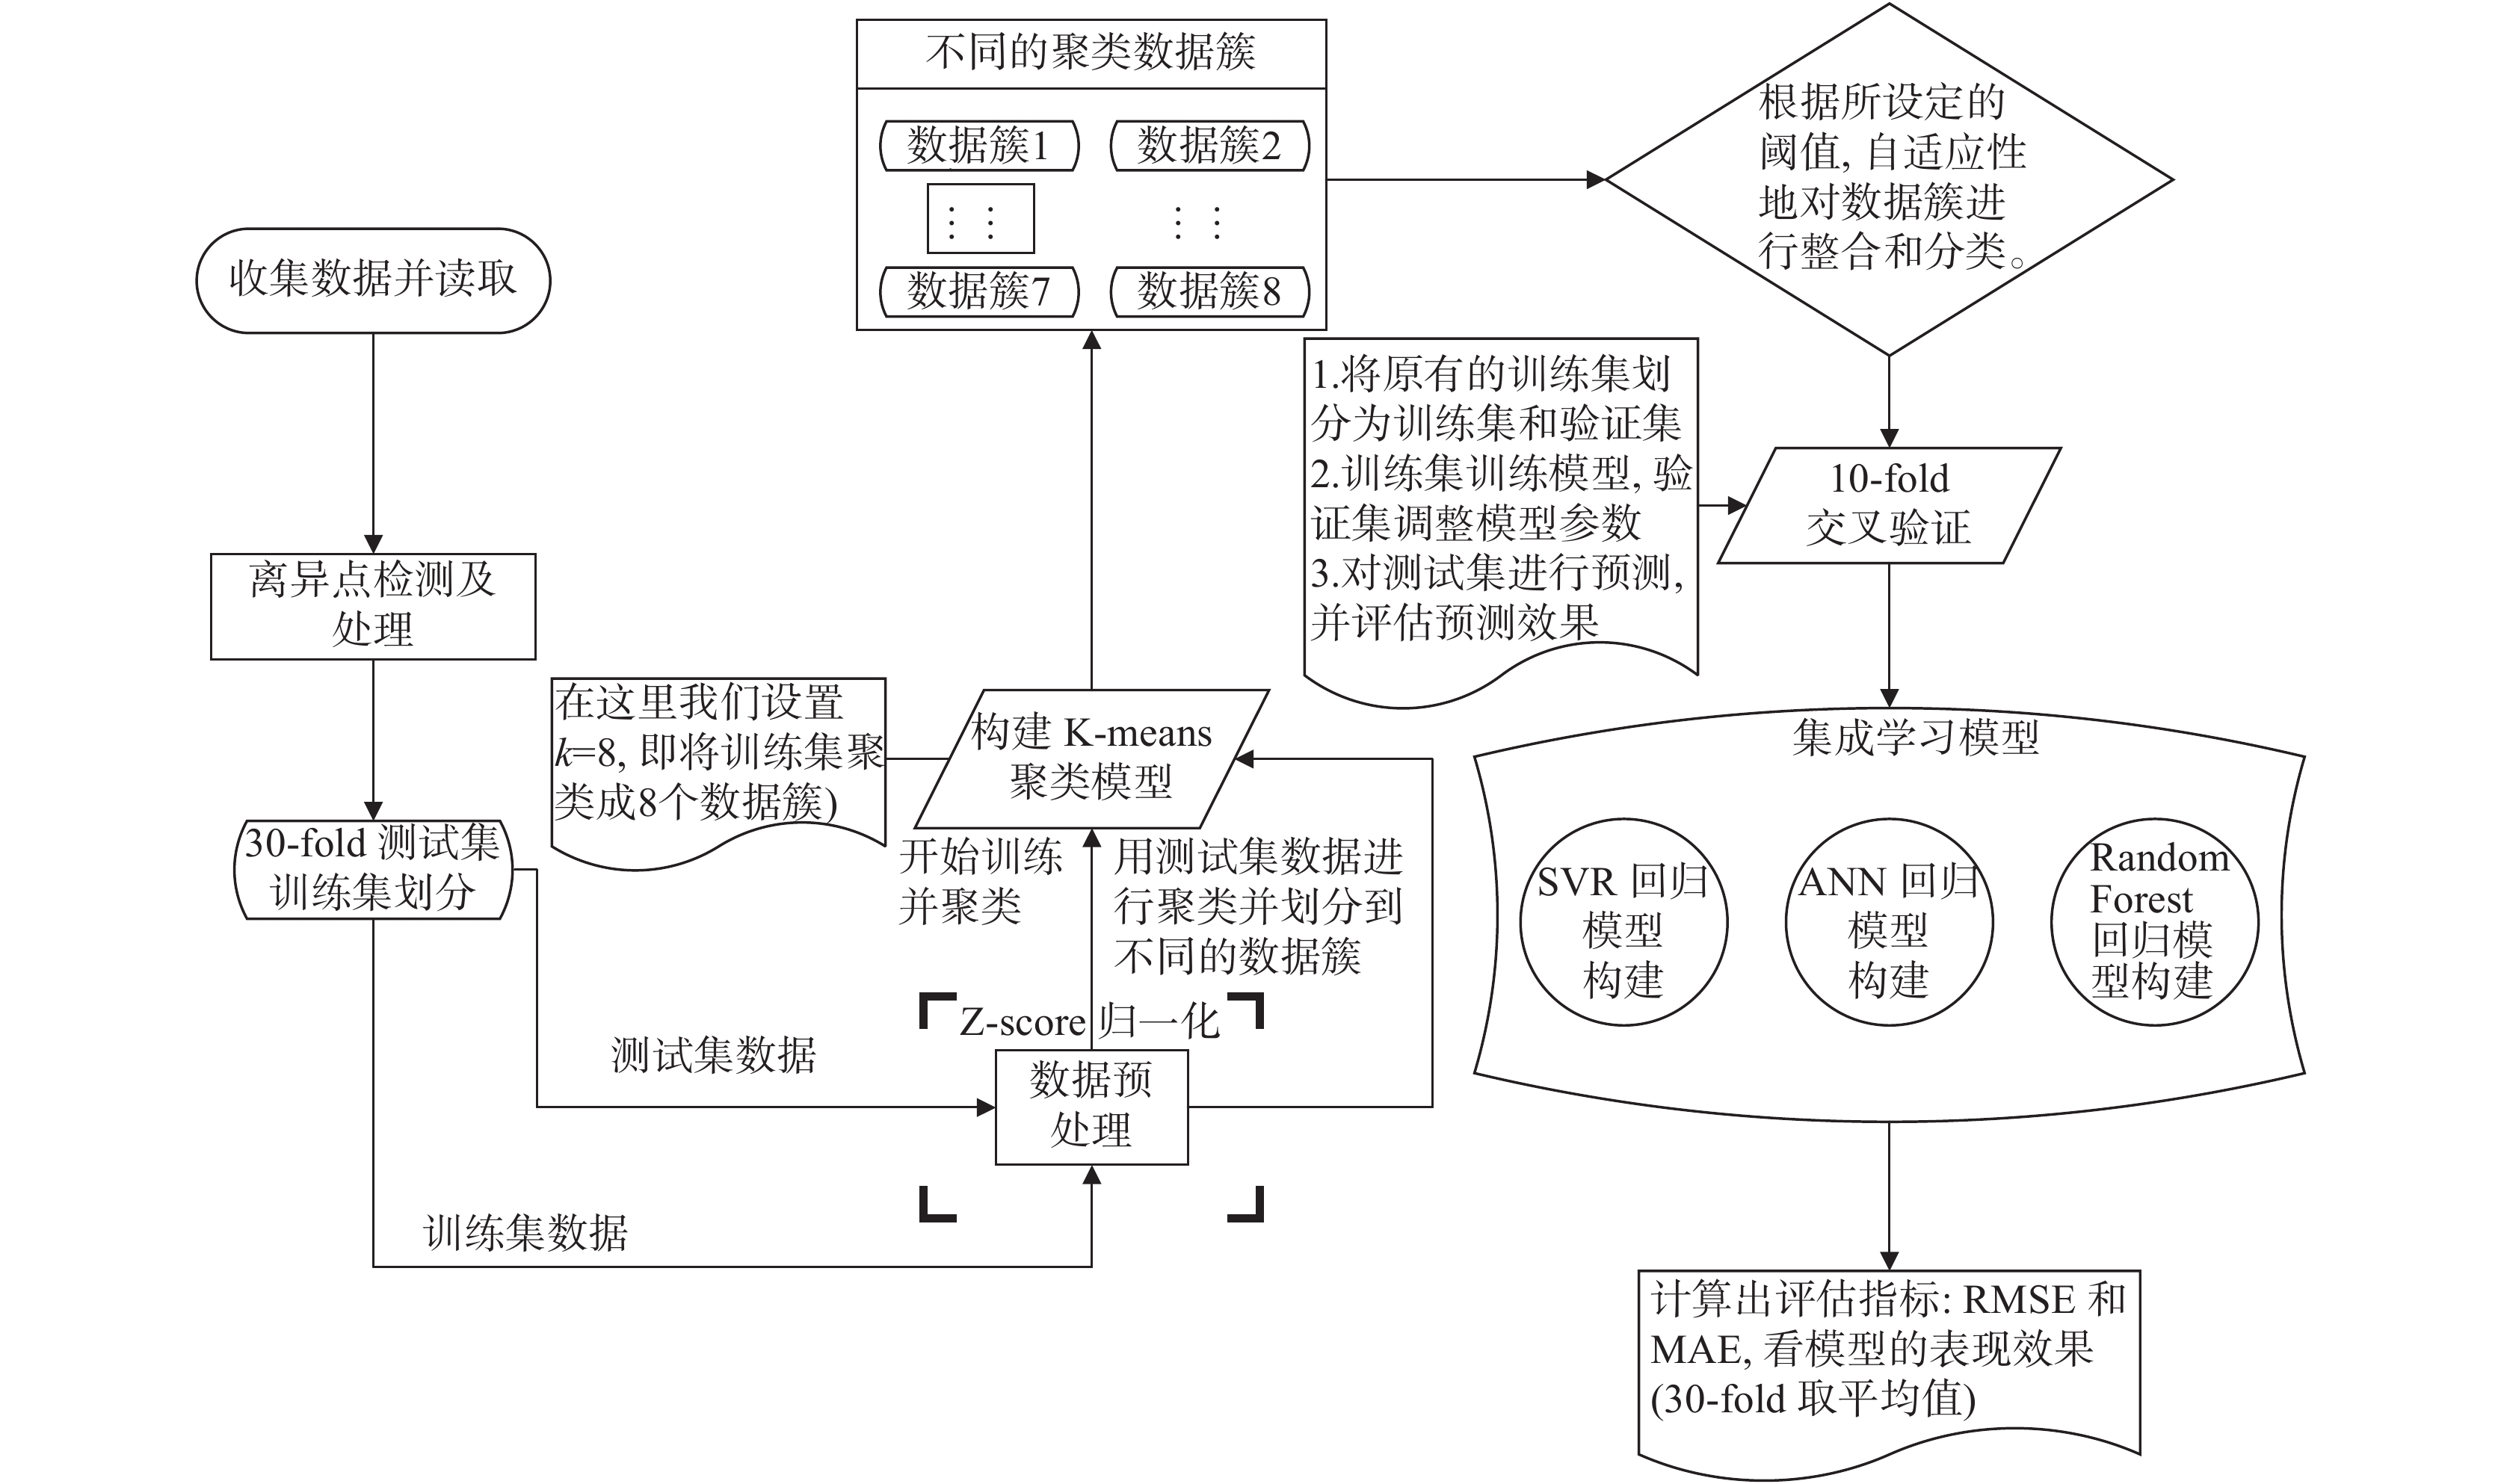
图 1 机器学习回归模型构建过程示意
Figure 1. Schematic diagram of construction process of machine learning regression model

图 3 集成学习(Ensemble learning)回归模型构建过程示意
Figure 3. Schematic diagram of the construction process of ensemble learning regression model
表 1 五个属性变量和目标变量的分析指标
Table 1. Analysis index of five attribute variables and target variables
属性\分析指标 皮尔逊相关系数 统计变量P值 残余物 0.0149 0.3697 Ti3+含量 −0.0192 0.2501 TiO2含量 −0.0789 1.602×10⁻⁶ Fe/TiO2 0.1185 9.334×10⁻¹³ F值 −0.0792 1.934×10⁻⁶  下载: 导出CSV
表 2 离异值处理前后五个属性变量和目标变量的分析指标对比
Table 2. Comparison of attribute variables and target variables before and after outlier data processing
属性\分析指标 残余物 Ti3+含量 TiO2含量 Fe/TiO2 F值 皮尔逊相关系数 离异值处理前 0.0149 −0.0192 −0.0789 0.1185 −0.0792 统计变量P值 0.3697 0.2501 1.602×10⁻⁶ 9.334×10⁻¹³ 1.934×10⁻⁶ 皮尔逊相关系数 离异值处理后 0.0548 −0.0344 −0.0231 0.0560 −0.1545 统计变量P值 0.0032 0.0643 0.2151 0.0026 7.147×10⁻¹⁷
下载: 导出CSV
表 3 离异值处理后数据的六种经典机器学习回归模型评估指标
Table 3. Evaluation indexes of six classical machine learning regression models after outlier data processing
Ridge Lasso KNN ANN Random Forest SVR RMSE MAE RMSE MAE RMSE MAE RMSE MAE RMSE MAE RMSE MAE 1 0.2648 0.2005 0.2684 0.2088 0.2671 0.2043 0.2688 0.2062 0.2710 0.2074 0.2752 0.2136 2 0.3435 0.2010 0.3515 0.2042 0.3542 0.2118 0.3482 0.2081 0.3519 0.2117 0.3515 0.2094 3 0.2466 0.1889 0.2456 0.1923 0.2565 0.1971 0.2460 0.1904 0.2577 0.1951 0.2504 0.1950 4 0.3767 0.2279 0.3778 0.2277 0.3814 0.2268 0.3766 0.2270 0.3744 0.2231 0.3823 0.2261 5 0.4396 0.2409 0.4418 0.2418 0.4439 0.2481 0.4447 0.2447 0.4464 0.2488 0.4498 0.2451 6 0.2279 0.1755 0.2248 0.1750 0.2335 0.1791 0.2272 0.1757 0.2432 0.1851 0.2365 0.1816 7 0.3370 0.2087 0.3328 0.2081 0.3354 0.2112 0.3337 0.2068 0.3302 0.2063 0.3424 0.2123 8 0.3396 0.2230 0.3381 0.2296 0.3412 0.2224 0.3371 0.2239 0.3342 0.2225 0.3477 0.2292 9 0.3152 0.2199 0.3171 0.2184 0.3080 0.2167 0.3145 0.2190 0.3169 0.2236 0.3243 0.2245 10 0.2646 0.1968 0.2688 0.1983 0.2571 0.1869 0.2656 0.1970 0.2596 0.1911 0.2626 0.1936 11 0.2636 0.2008 0.2739 0.2077 0.2552 0.1999 0.2658 0.2017 0.2586 0.2050 0.2597 0.1971 12 0.2599 0.1863 0.2658 0.1935 0.2579 0.1850 0.2606 0.1868 0.2586 0.1849 0.2587 0.1815 13 0.2927 0.2158 0.3000 0.2224 0.2917 0.2169 0.2946 0.2173 0.2921 0.2183 0.2945 0.2134 14 0.2661 0.1960 0.2706 0.1964 0.2704 0.1952 0.2647 0.1933 0.2640 0.1927 0.2660 0.1963 15 0.2197 0.1757 0.2286 0.1818 0.2239 0.1801 0.2206 0.1754 0.2184 0.1750 0.2144 0.1696 16 0.2215 0.1836 0.2285 0.1879 0.2226 0.1841 0.2204 0.1826 0.2229 0.1822 0.2138 0.1716 17 0.2433 0.1902 0.2491 0.1935 0.2423 0.1929 0.2384 0.1889 0.2375 0.1902 0.2450 0.1913 18 0.2780 0.1866 0.2826 0.1886 0.2810 0.1900 0.2793 0.1861 0.2845 0.1948 0.2811 0.1835 19 0.2286 0.1741 0.2245 0.1715 0.2230 0.1730 0.2262 0.1731 0.2246 0.1713 0.2219 0.1676 20 0.2705 0.2086 0.2779 0.2133 0.2770 0.2132 0.2710 0.2087 0.2695 0.2100 0.2726 0.2077 21 0.2473 0.1803 0.2489 0.1805 0.2484 0.1789 0.2474 0.1796 0.2459 0.1785 0.2447 0.1735 22 0.2867 0.2148 0.2866 0.2129 0.2879 0.2137 0.2836 0.2114 0.2817 0.2095 0.2809 0.2043 23 0.3342 0.2224 0.3322 0.2221 0.3262 0.2131 0.3315 0.2213 0.3313 0.2179 0.3358 0.2183 24 0.2052 0.1733 0.1950 0.1644 0.1933 0.1632 0.2009 0.1697 0.1967 0.1661 0.1905 0.1606 25 0.2135 0.1704 0.2014 0.1558 0.2120 0.1721 0.2254 0.1827 0.2330 0.1887 0.2051 0.1626 26 0.3247 0.2135 0.3338 0.2303 0.3255 0.2174 0.3294 0.2217 0.3402 0.2339 0.3316 0.2231 27 0.1965 0.1527 0.2050 0.1591 0.1960 0.1516 0.1973 0.1520 0.2047 0.1568 0.1947 0.1486 28 0.1872 0.155 0.1795 0.1467 0.1923 0.1614 0.1928 0.1614 0.1992 0.1646 0.2024 0.1691 29 0.2395 0.1984 0.2335 0.1964 0.2489 0.2059 0.2363 0.1970 0.2432 0.2026 0.2353 0.1916 30 0.3144 0.2004 0.3148 0.2024 0.3195 0.2080 0.3149 0.2023 0.3186 0.2055 0.3153 0.1981
下载: 导出CSV
表 4 离异值处理前后样本的六种回归模型评估指标(30次预测的平均值)对比
Table 4. Comparison of six regression model evaluation indexes of samples before and after outlier data processing
指标 Ridge Lasso KNN ANN Random Forest SVR 离异值处理后 RMSE 0.2750 0.2766 0.2758 0.2758 0.2766 0.2762 MAE 0.1961 0.1977 0.1973 0.1971 0.1983 0.1953 离异值处理前 RMSE 0.3020 0.3037 0.3002 0.2980 0.3023 0.2995 MAE 0.2092 0.2119 0.2083 0.2082 0.2113 0.2055
下载: 导出CSV
表 5 离异值处理后样本进行集成学习(Ensemble learning)回归模型评估指标
Table 5. Ensemble learning regression model evaluation indexes of samples after outlier data processing
指标 1 2 3 4 5 6 7 8 9 10 RMSE 0.2287 0.1973 0.2334 0.2541 0.2822 0.2312 0.3234 0.2560 0.3522 0.2376 MAE 0.1898 0.1624 0.1843 0.1742 0.2056 0.1848 0.2450 0.1766 0.2835 0.1805 指标 11 12 13 14 15 16 17 18 19 20 RMSE 0.2775 0.2061 0.2749 0.2051 0.1986 0.1857 0.2401 0.2670 0.2543 0.2147 MAE 0.2200 0.1573 0.2084 0.1634 0.1693 0.1553 0.1866 0.1906 0.1927 0.1779 指标 21 22 23 24 25 26 27 28 29 30 RMSE 0.2230 0.2468 0.3560 0.2035 0.2404 0.2712 0.1795 0.2105 0.2357 0.3124 MAE 0.1780 0.1987 0.2688 0.1628 0.1848 0.2169 0.1464 0.1840 0.1914 0.2488
下载: 导出CSV
表 6 单个回归模型和集成模型学习评估指标(30次预测的平均值)对比
Table 6. Comparison of single regression model and ensemble model learning evaluation index
指标 Ridge Lasso KNN ANN Random forest SVR Ensemble learning (Random forest+SVR+ANN) RMSE 0.2750 0.2766 0.2758 0.2758 0.2766 0.2762 0.2454 MAE 0.1961 0.1977 0.1973 0.1971 0.1983 0.1953 0.1919
下载: 导出CSV
-
[1] Santacesatia E. Kinetics of titanium dioxide precipitation by thermal hydrolysis[J]. Journal of Colloid and Interface Science, 1986, 111(1): 45-53. [2] Duncan J F, Richards R G. Solution equilibriums, kinetics and mechanism[J]. N. Z J. Sci., 1976,19(2):179−183. [3] Chen Hongyun, Jin Bin, Dong Yingjie, et al. Study on determination of the average particle size of TiO2 by use of laser particle sizer[J]. Paint & Coating Industry, 2002,32(6):40−42. (陈洪云, 金斌, 董英杰, 等. 激光粒度仪测定钛白粉平均粒径的研究[J]. 涂料工业, 2002,32(6):40−42. doi: 10.3969/j.issn.0253-4312.2002.06.016 [4] (张立德, 牟季美. 纳米材料与纳米结构[M]. 北京: 科学出版社, 2002.)Zhang Lide, Mou Jimei. Nanometer materials & nanometer structure[M]. Beijing: Science Press, 2002. [5] (GB/T 19627—2005. 粒度分析光子相关光谱法[S].)GB/T 19627—2005. Particle size analysis- photon correlation spectroscopy[S]. [6] Tian Congxue, Hu Hongfei, Du Jianqiao, et al. Determination of the particle size distribution of metatitanic acid by photon correlation spectroscopy[J]. Iron Steel Vanadium Titanium, 2010,31(2):15−19. (田从学, 胡鸿飞, 杜剑桥, 等. 用光子相关光谱法测定偏钛酸粒度分布[J]. 钢铁钒钛, 2010,31(2):15−19. doi: 10.7513/j.issn.1004-7638.2010.02.004 [7] (何桢. 六西格玛管理[M]. 北京: 中国人民大学出版社, 2014.)He Zhen. Six Sigma management[M]. Beijing: China Renmin University Press, 2014. [8] Kadlec P, Grbic R, Gabrys B. Review of adaptation mechanisms for data-driven soft sensors[J]. Computers & Chemical Engineering, 2011,35(1):1−24. [9] Kano M, Ogawa M. The state of the art in chemical process control in Japan: Good practice and questionnaire survey[J]. Journal of Process Control, 2010,20(9):969−982. doi: 10.1016/j.jprocont.2010.06.013 [10] Zhao F, Lu N, Lu J. Quality control of batch processes using natural gradient based model-free optimization[J]. Industrial & Engineering Chemistry Research, 2014,53(44):17419−17428. -


 点击查看大图

计量
- 文章访问数: 378
- HTML全文浏览量: 71
- PDF下载量: 44
- 被引次数: 0