Assessing the role of vanadium technologies in decarbonizing hard-to-abate sectors and enabling the energy transition
-
摘要: 重工业的减碳和可再生能源技术的出现皆与获得矿物资源有着密不可分的联系。因此,迫切需要对关键元素在减少温室气体排放方面的作用进行基准评估。考察了钒作为微合金元素在建筑碳减排以及作为电网储能用液流电池的主要成分在能源转型中的作用。研究结果表明,钒可使每年减少总计1.85亿t碳排放。其中,中国和欧盟的减排幅度分别为各自排放量的1.15%和0.18%。研究结果强调了关键金属在发展低碳基础设施中的作用,同时指出了进行全面评估并施加政策干预减轻供应链风险的必要性。Abstract: The decarbonization of heavy industry and the emergence of renewable energy technologies are inextricably linked to access to mineral resources. As such, there is an urgent need to develop benchmarked assessments of the role of critical elements in reducing greenhouse gas emissions. Here, we explore the role of vanadium in decarbonizing construction by serving as a microalloying element and enabling the energy transition as the primary component of flow batteries used for grid-level storage. We estimate that vanadium has enabled an avoided environmental burden totaling 185 million metric tons of CO2 on an annual basis. A granular analysis estimates savings for China and the European Union at 1.15% and 0.18% of their respective emissions, respectively. Our results highlight the role of critical metals in developing low-carbon infrastructure while underscoring the need for holistic assessments to inform policy interventions that mitigate supply chain risks.
-
Key words:
- vanadium /
- microalloying /
- flow battery /
- environmental burden totaling of CO2
-
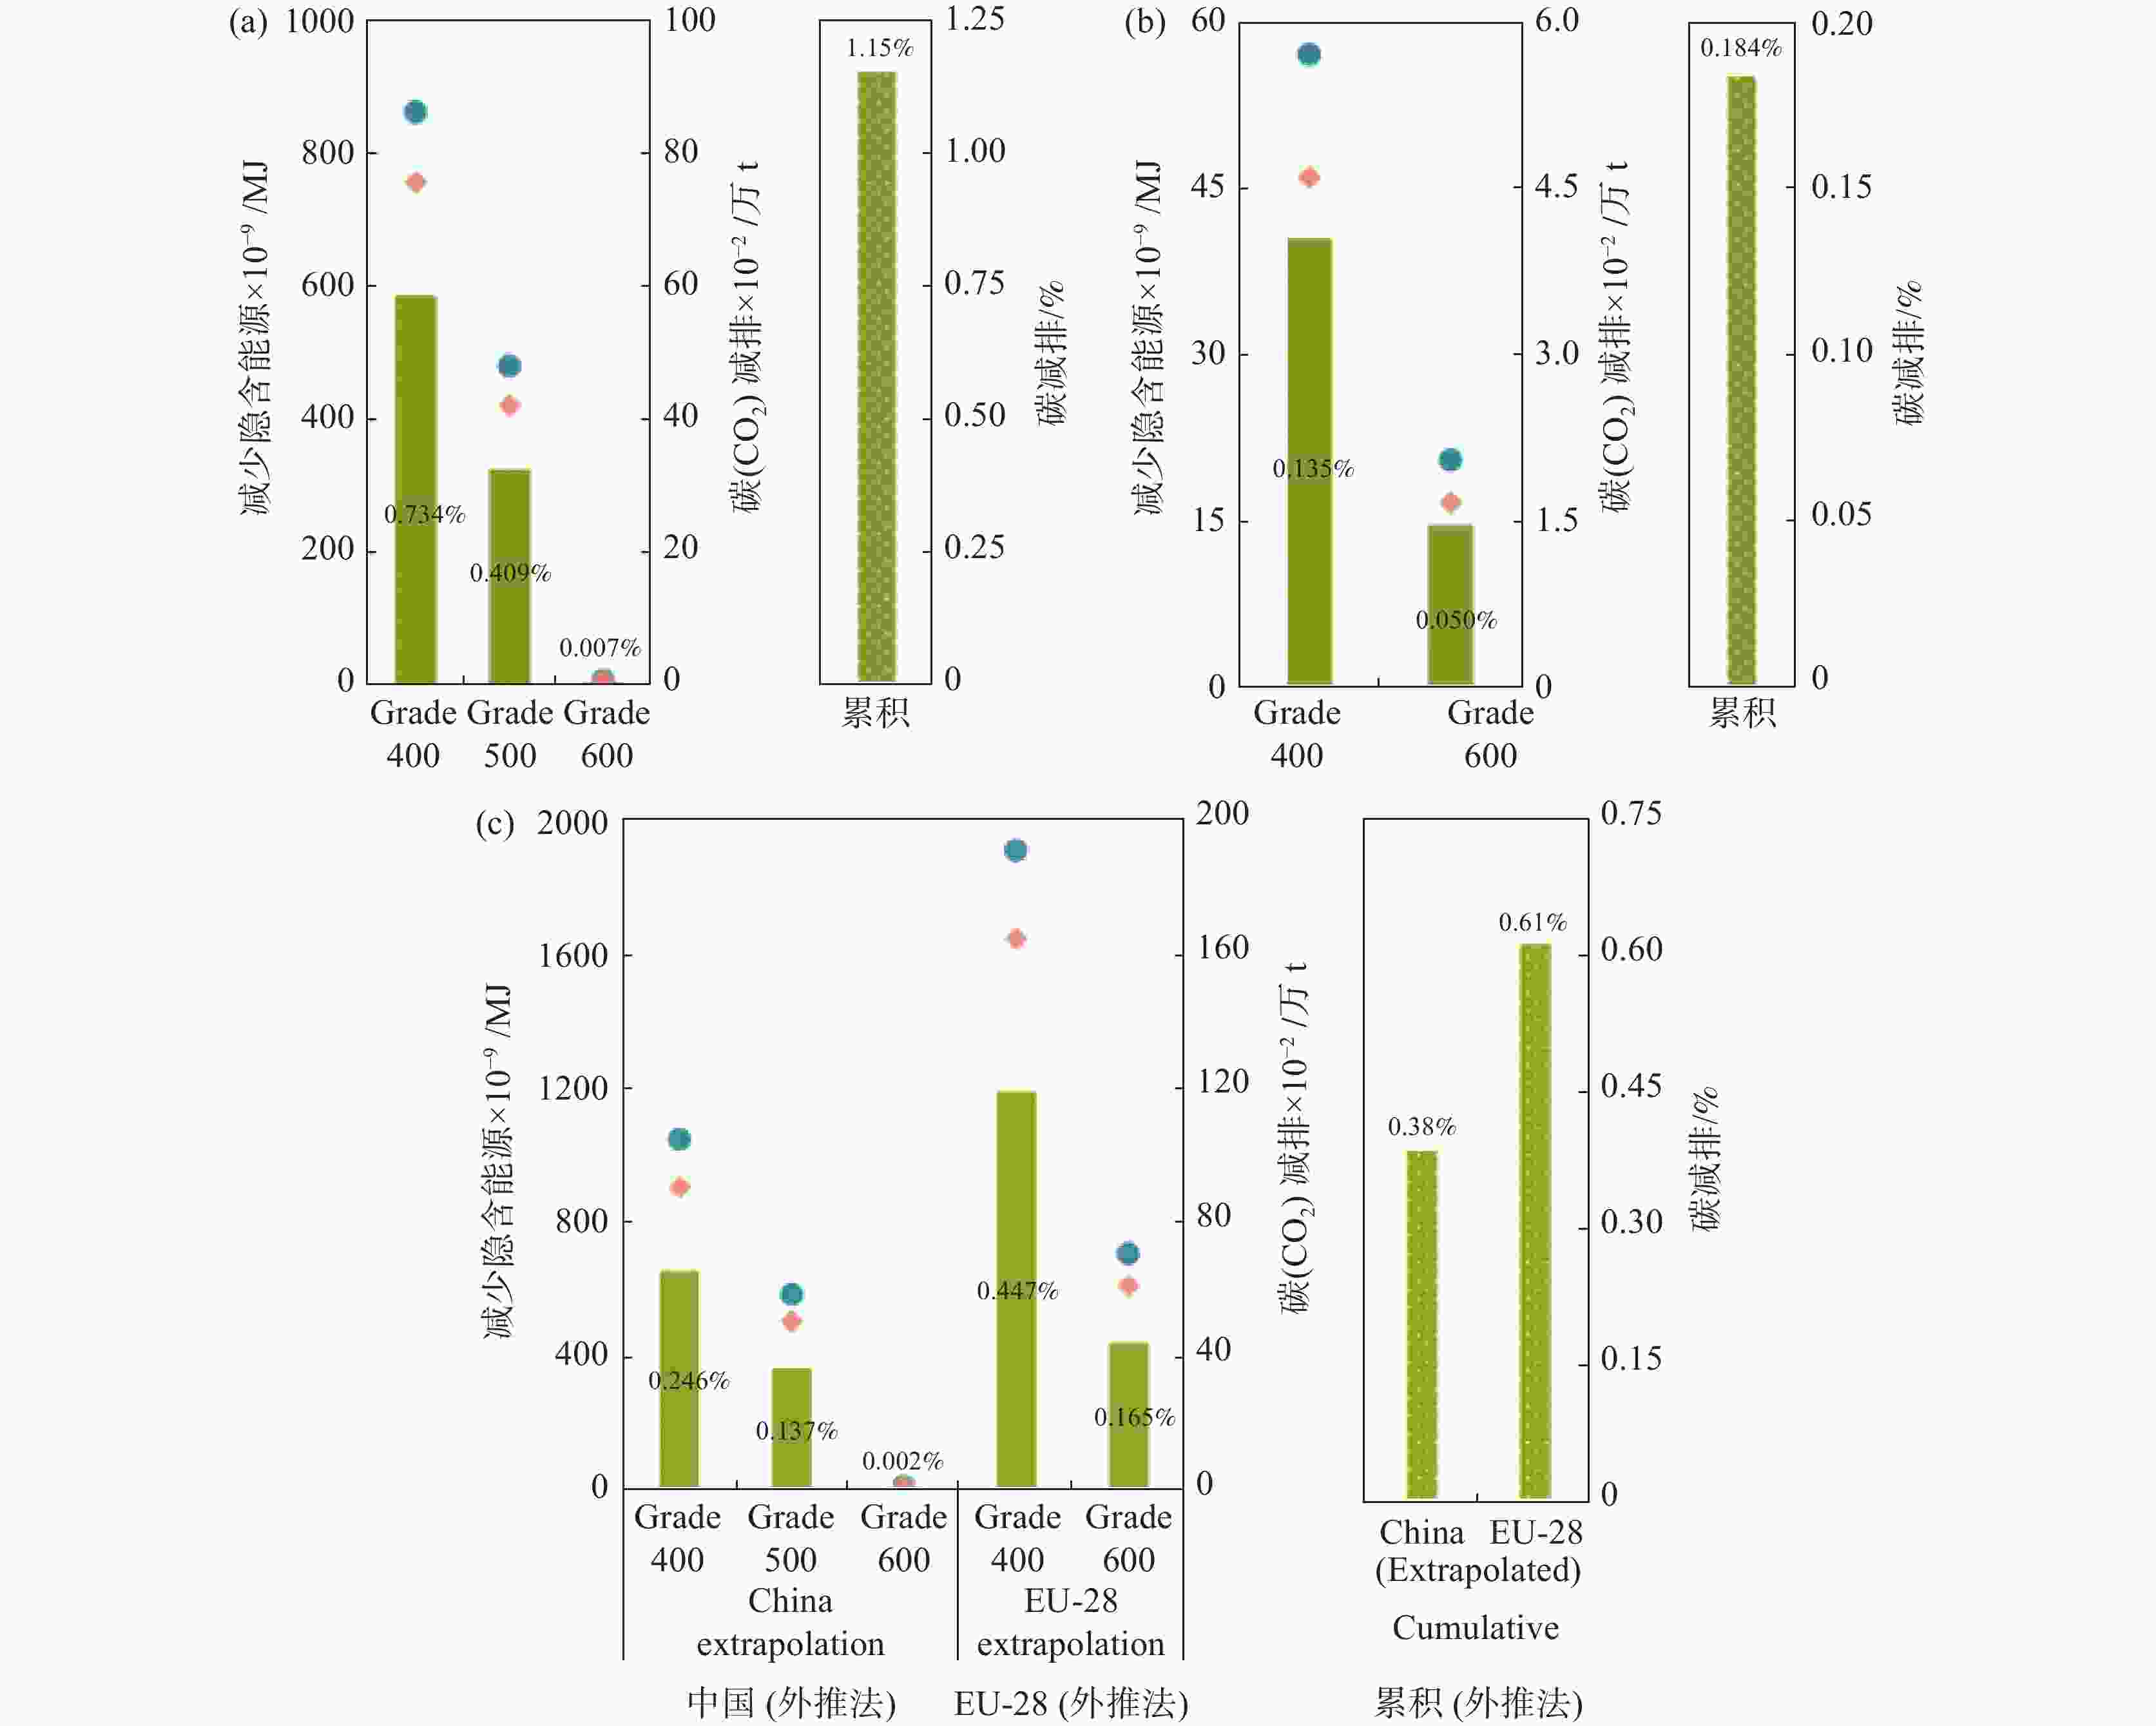
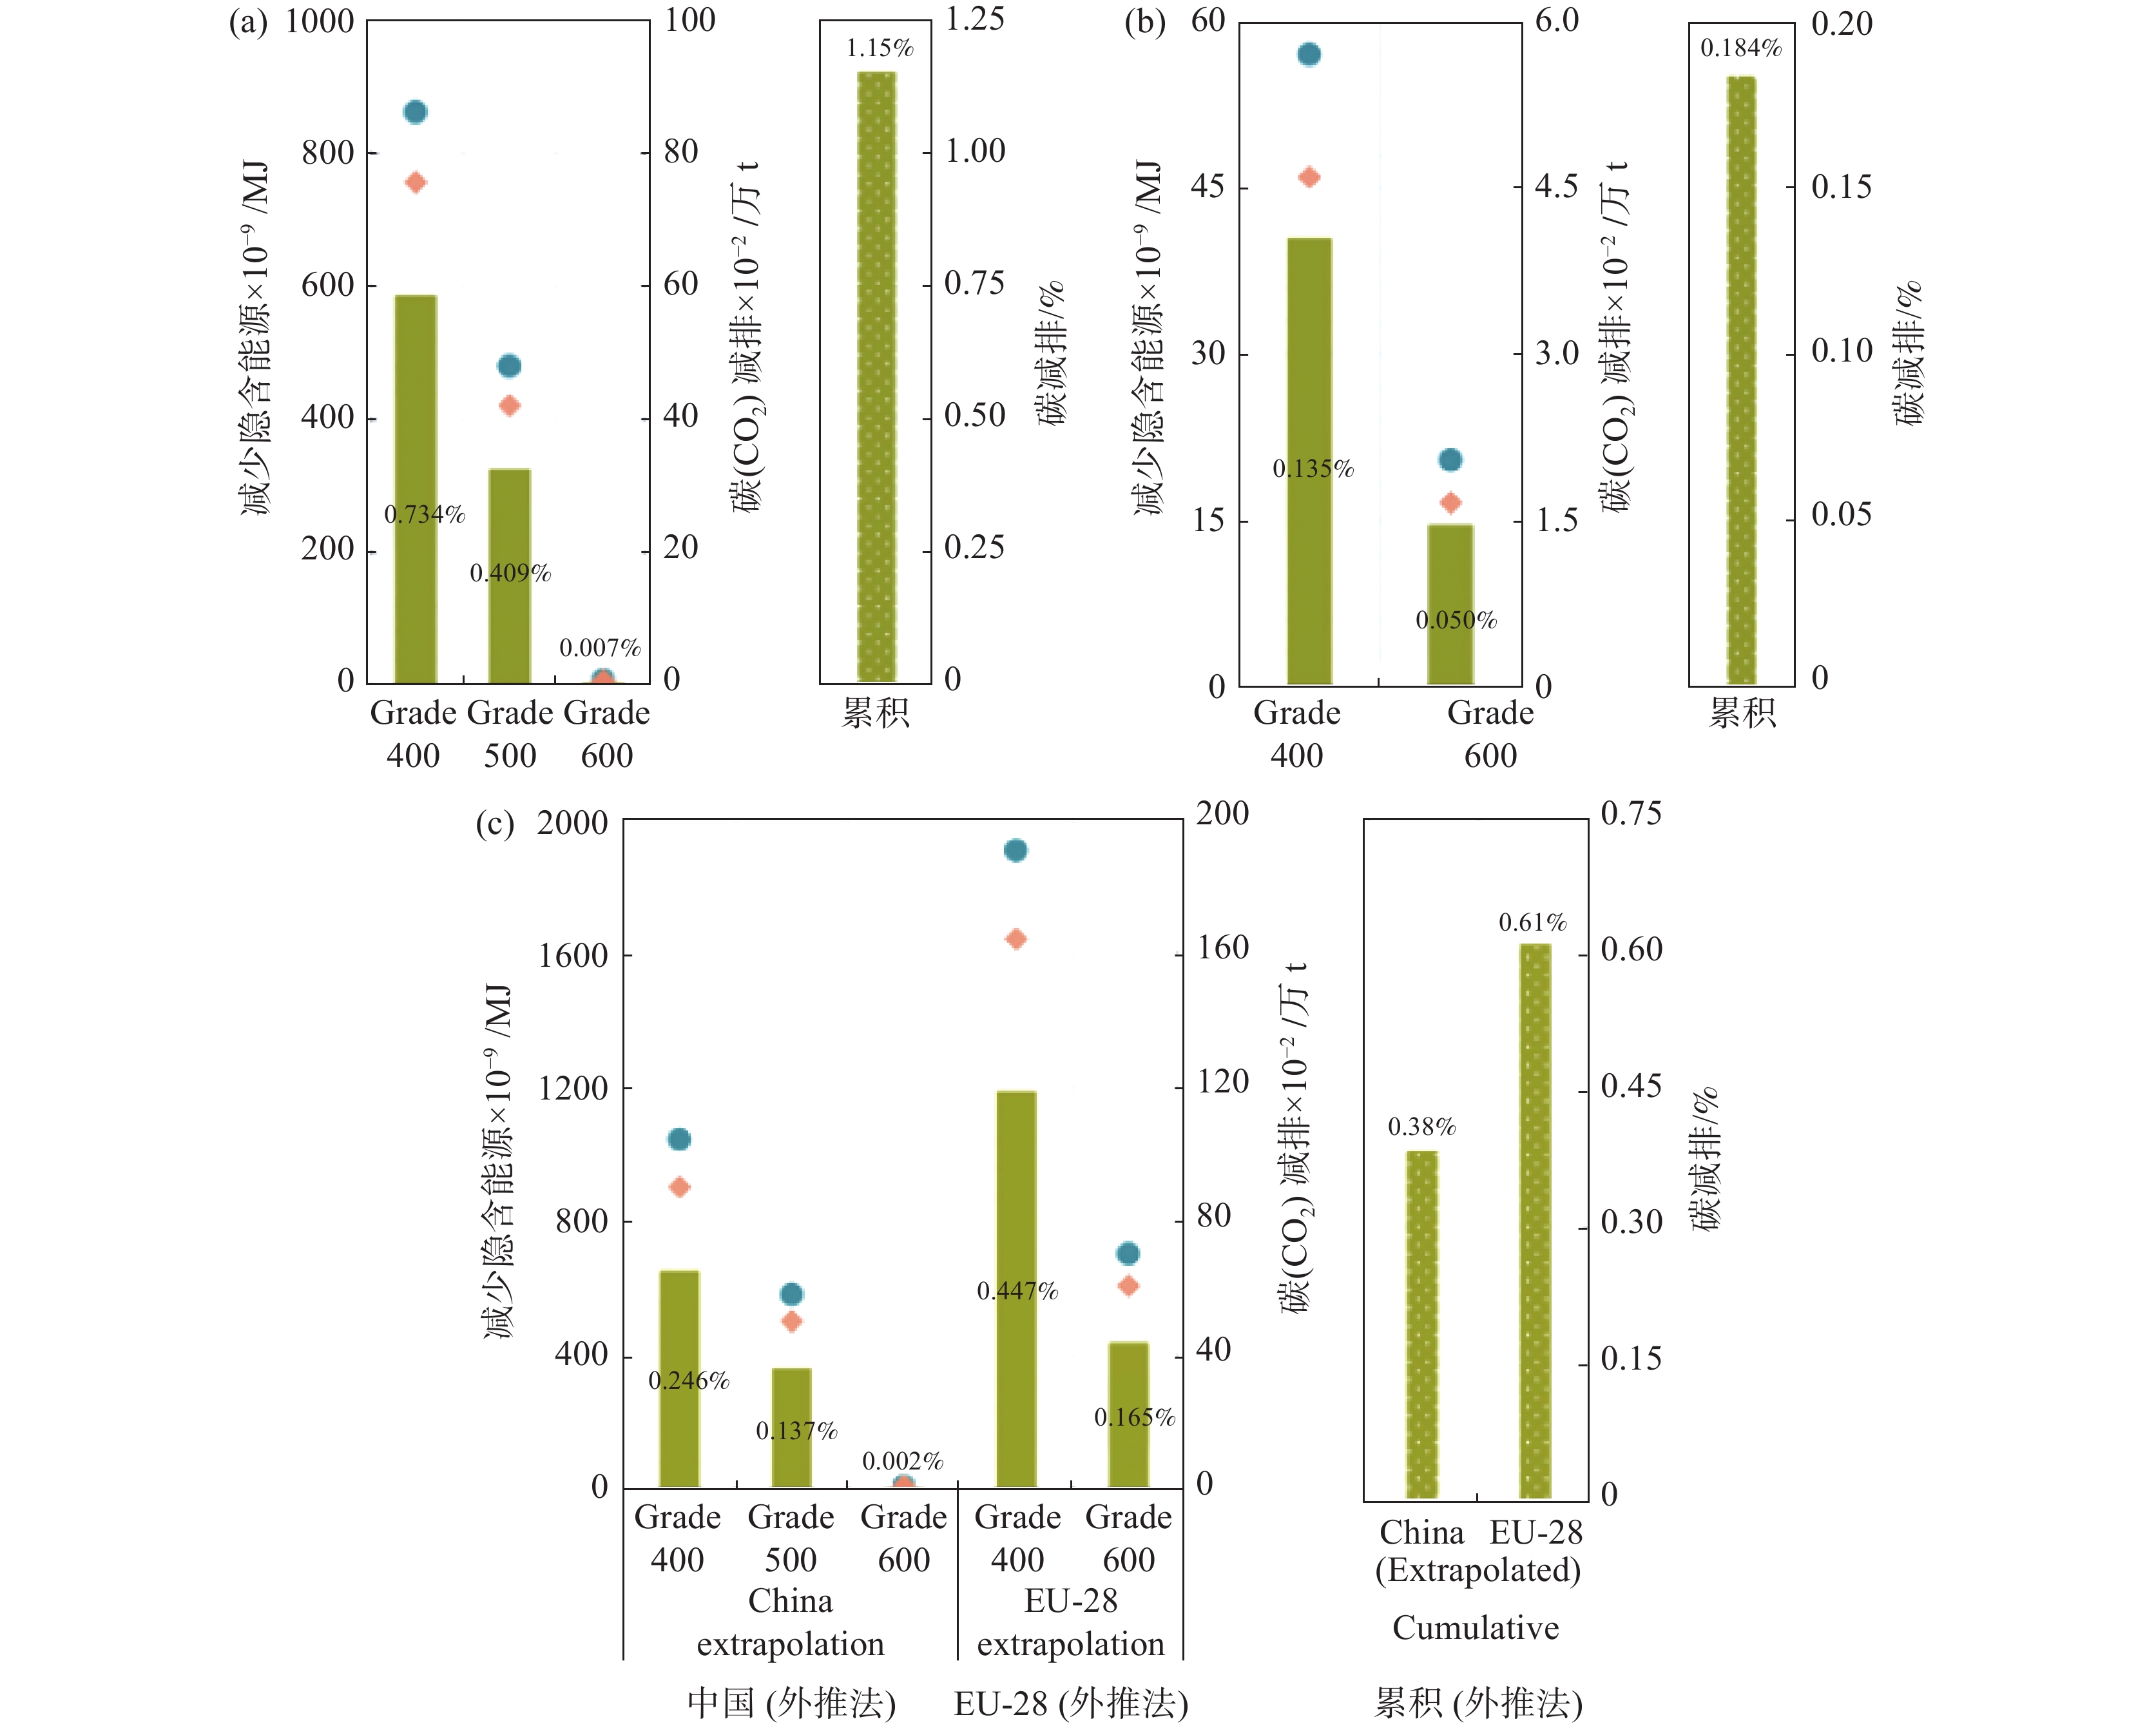
图 1 减少隐含能源与碳减排的地区差异
图中,减排量是使用2019年的数据计算的:(a)中国;(b)欧盟(EU-28);(c)全球(以中国和欧盟28国使用情景作为边界条件外推得到的数据)。节约的隐含能源(青色)和隐含碳(橙色)是采用螺纹钢市场的钒数据计算的,并通过已知地区的螺纹钢成分推算每个等级的钢产量和钒用量。对于全球情景分析,具体的隐含能源和隐含碳减排量是使用螺纹钢市场数据中的钒、中国和欧盟28国的数据以及每个等级占总钢比例加权钒量来计算的。以低碳钢(250 MPa)为参考,计算各等级钢的隐含能源和隐含碳的节约量。碳的减排百分比(黄绿色)是相对于各自的年度化石碳排放总量计算的
Figure 1. Regional variation in embodied energy and carbon savings
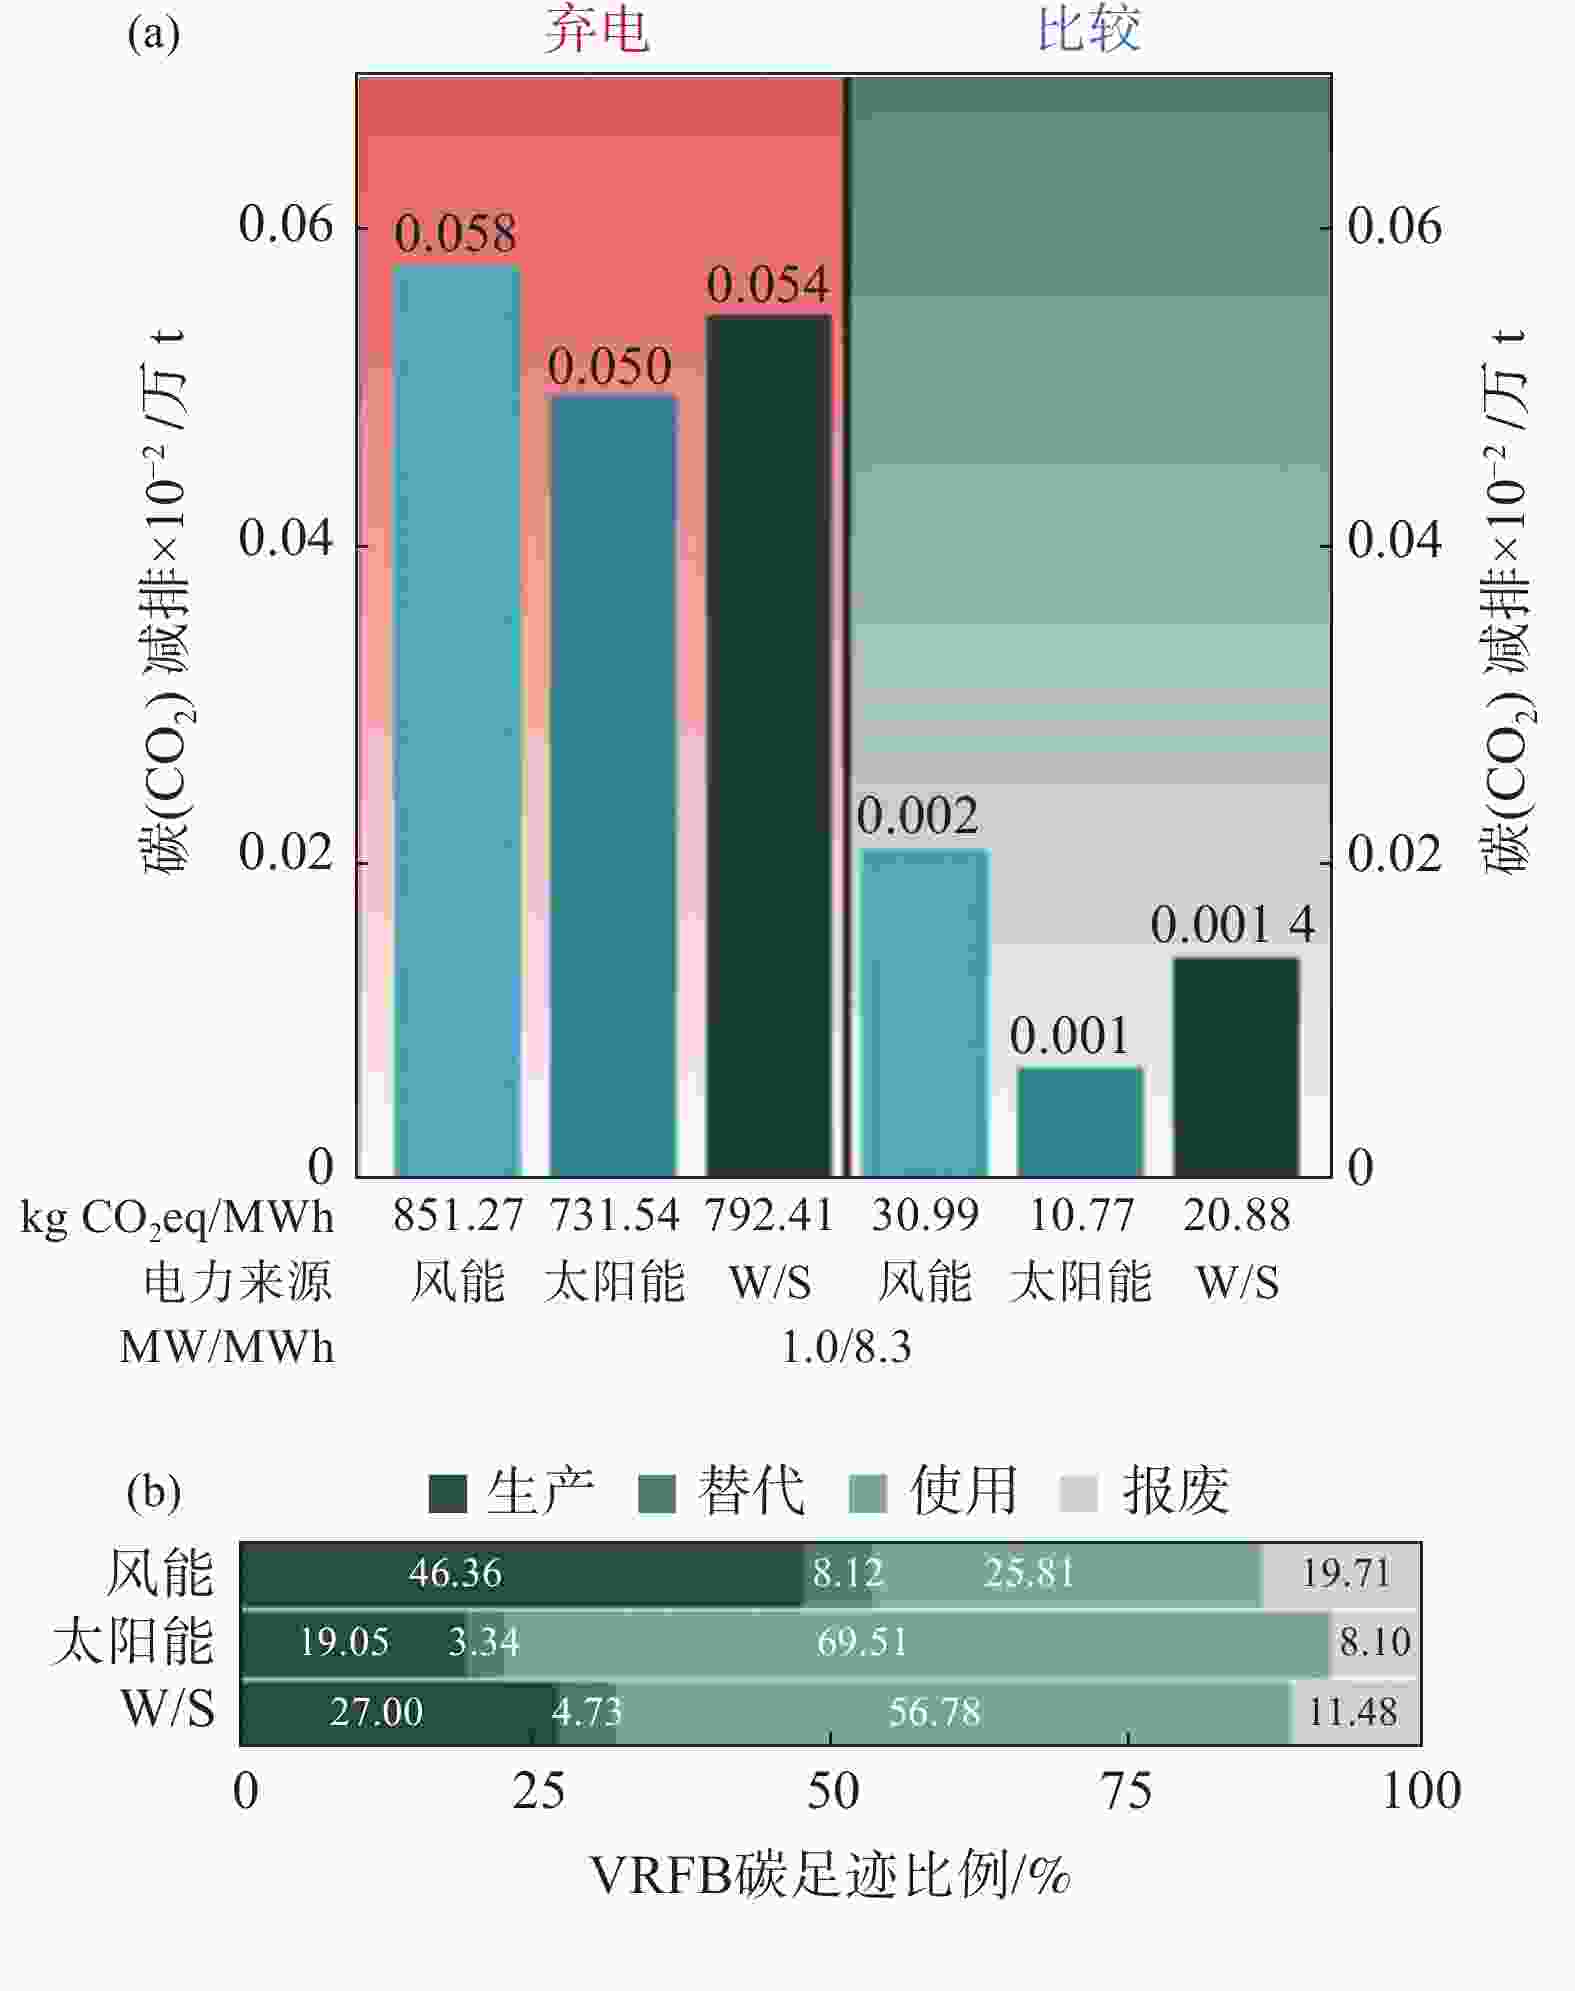
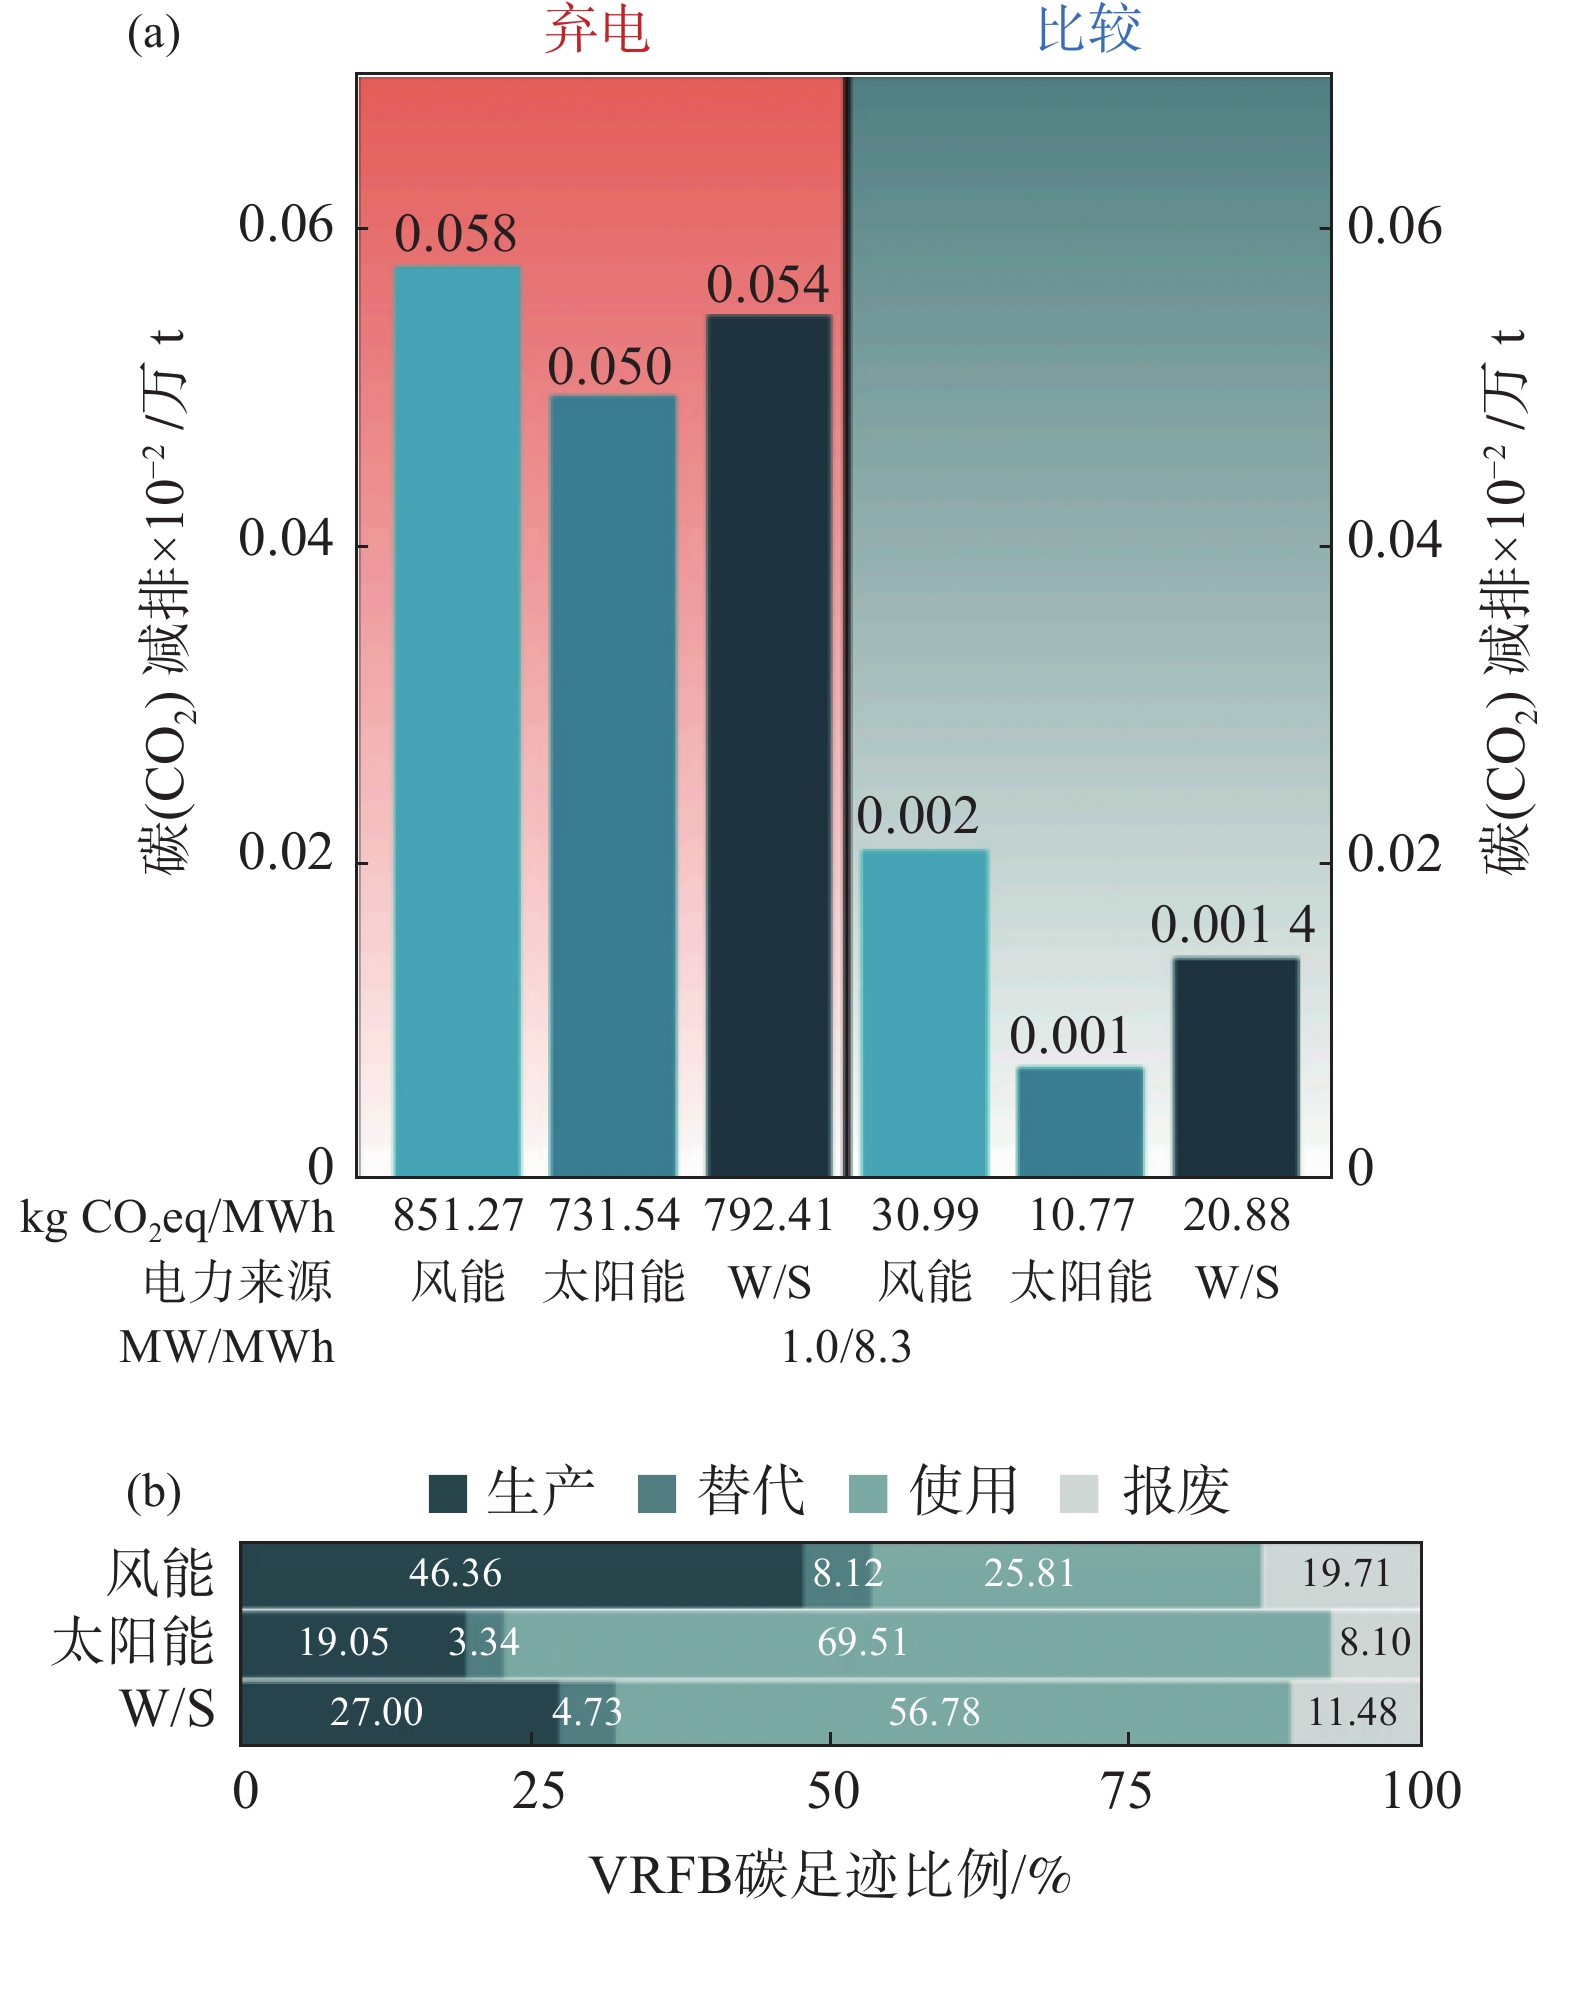
图 2 基准情景下VRFB碳排放量
(a) 列出了VRFB在20年寿命期间针对可再生能源弃电(橙色)和比较评估(绿色)情景的减排量。柱状图下面插入的表格与上面的列相对应,并给出了(从上到下)以kgCO2eq/MWh (kgCO2当量/MWh)为单位的标准化减排量、电源(风能、太阳能或风能/太阳能混合(W/S),以蓝色阴影区分)以及系统的额定功率和存储容量;(b) 每个生命周期阶段占VRFB碳足迹的比例
Figure 2. VRFB savings by the base case scenario
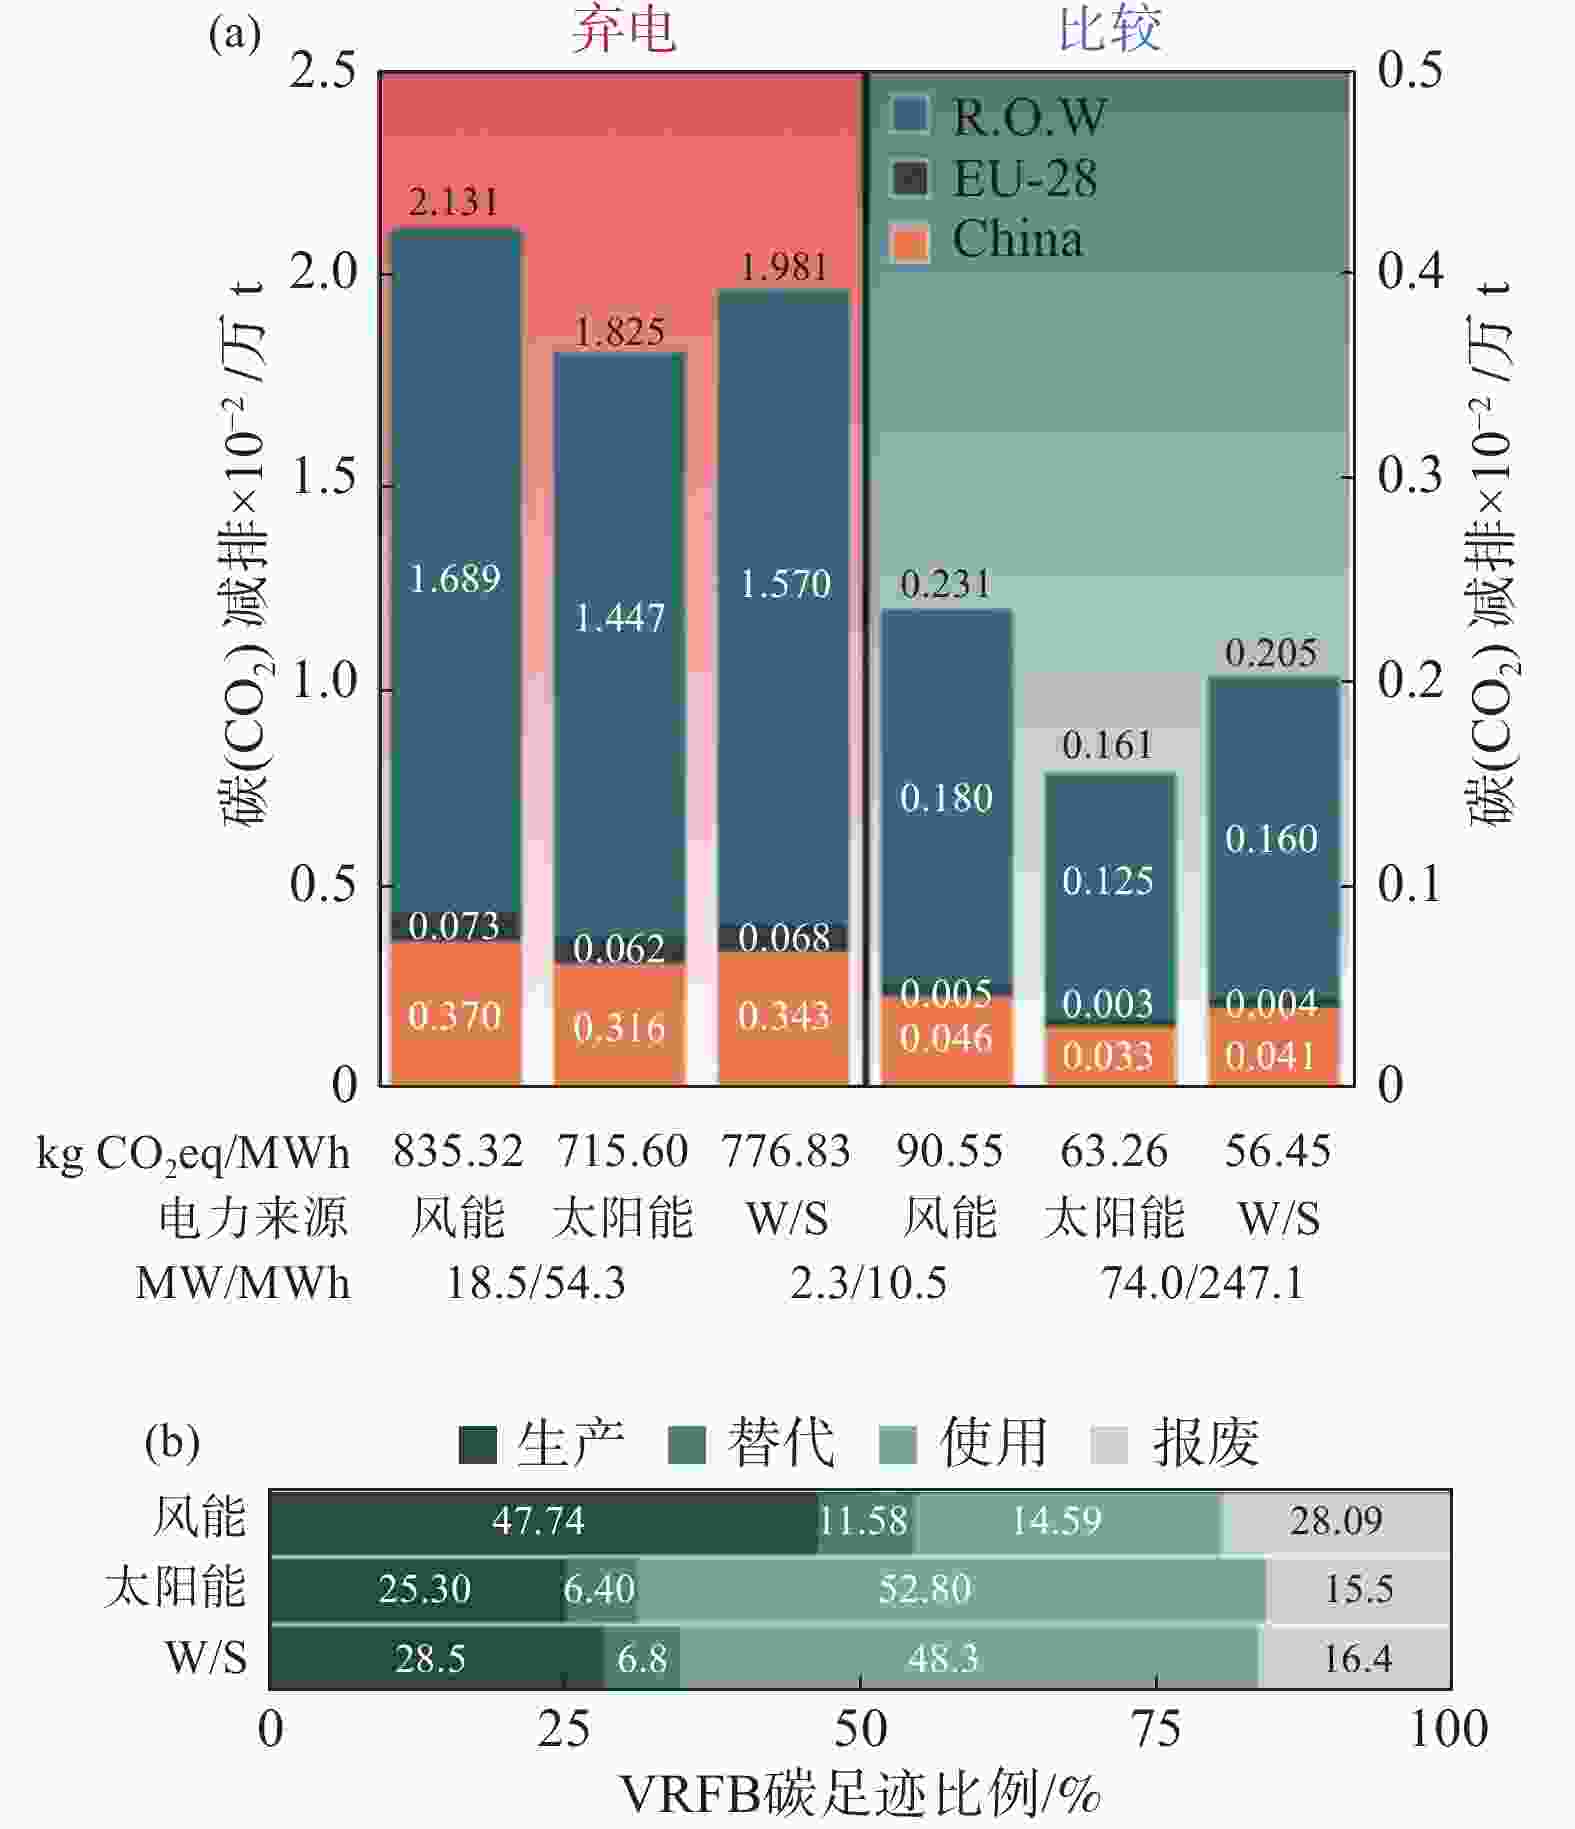
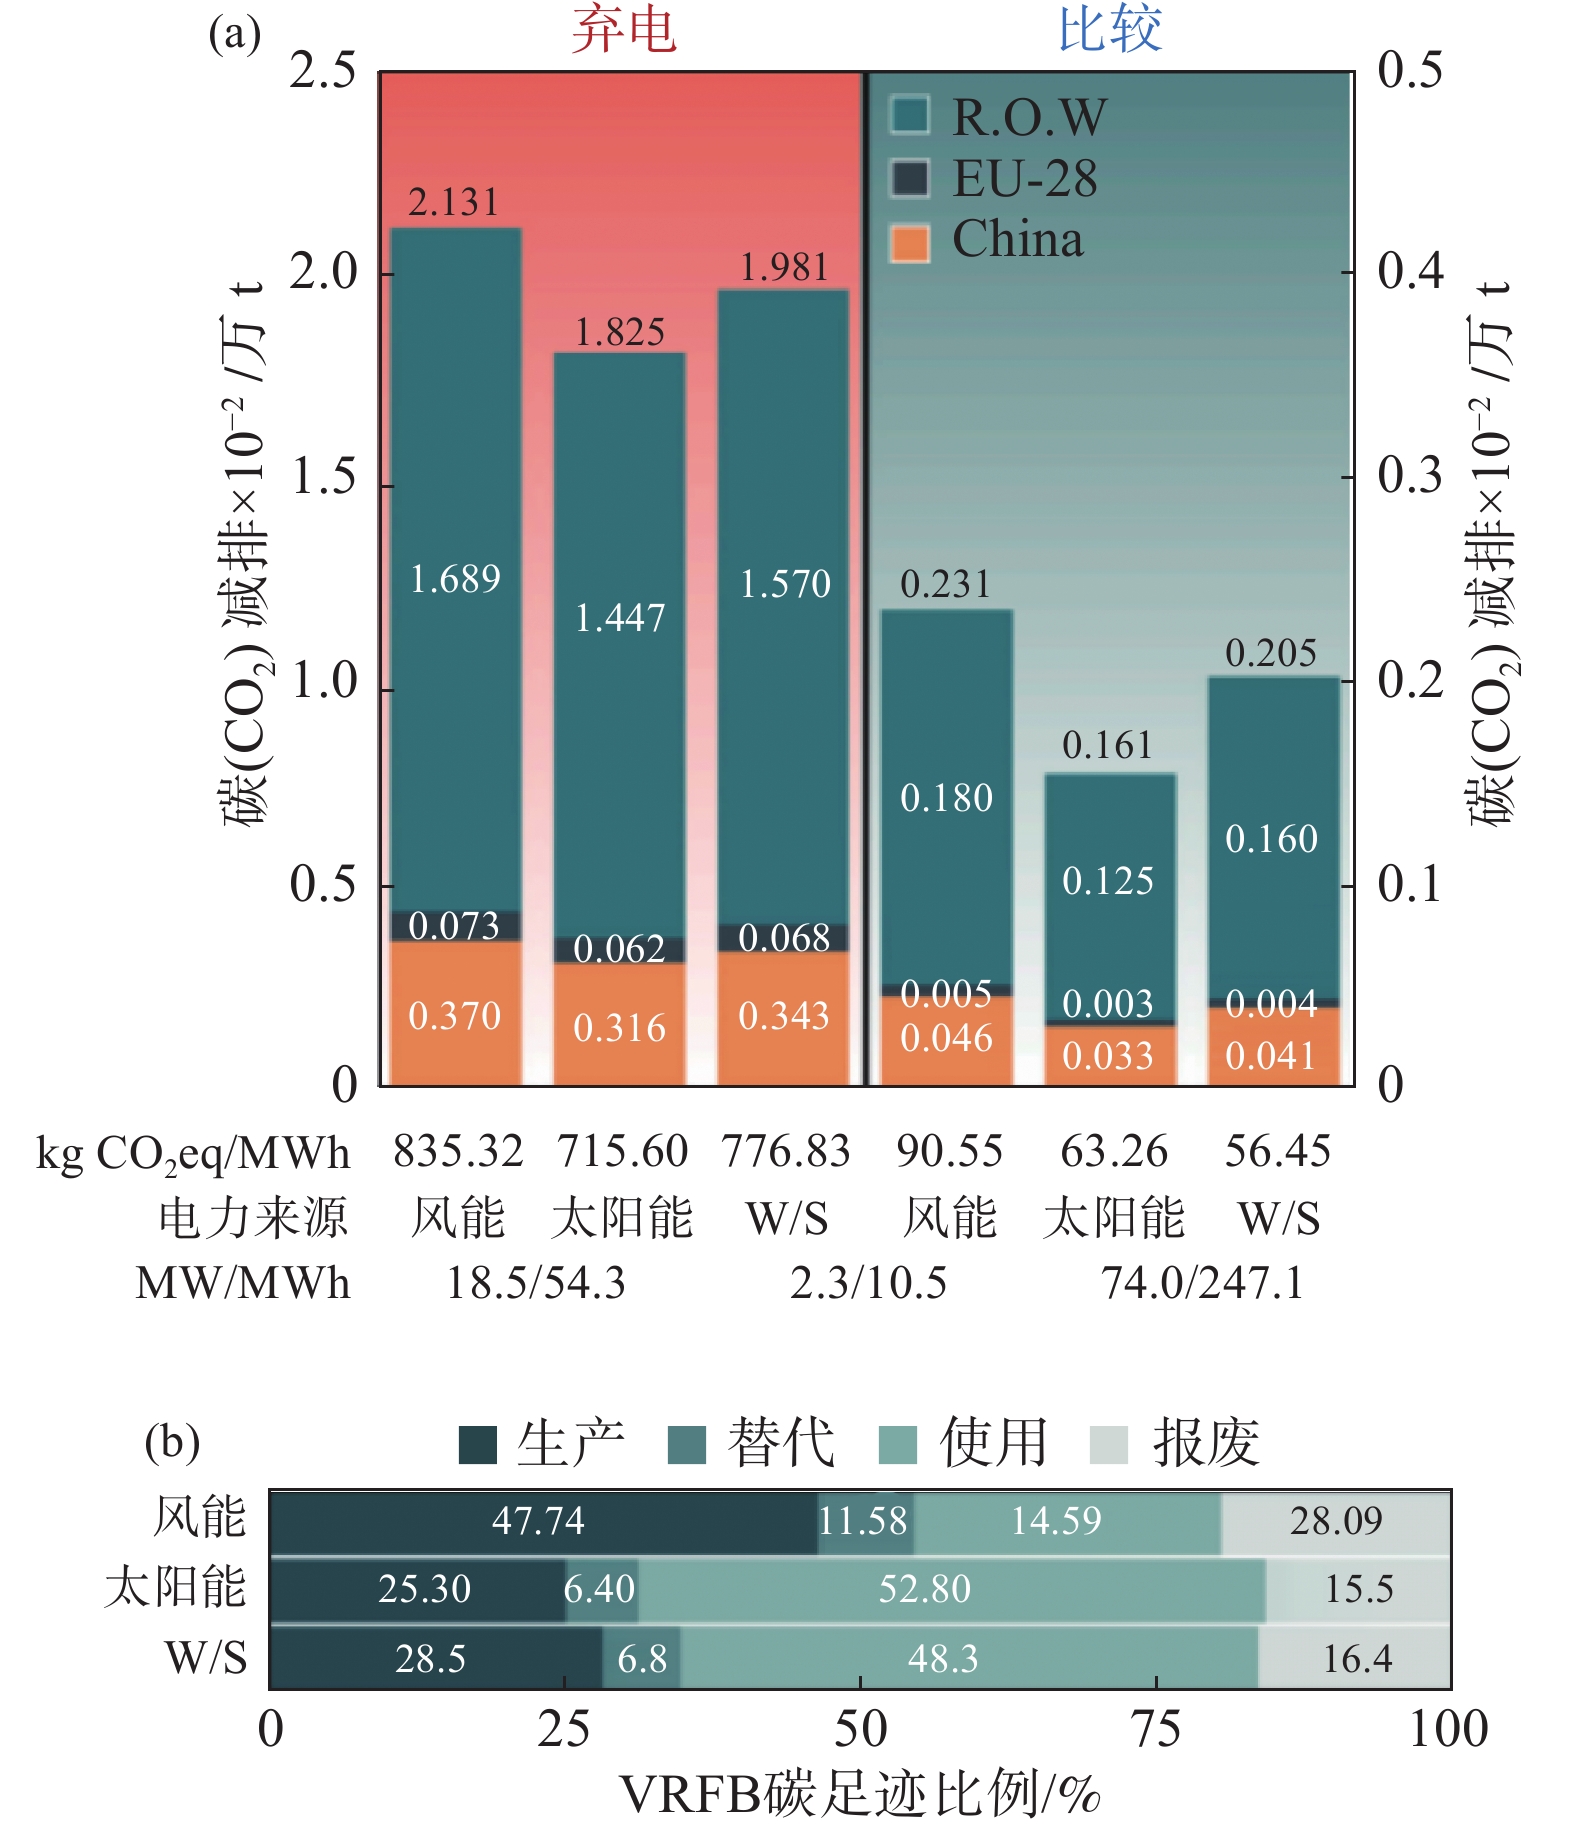
图 3 目前运行容量VRFB碳减排量
(a) 所有目前运行的VRFB在20年内针对可再生能源弃电(橙色)和比较评估(绿色)情景的减排量。中国(黄色)、欧盟28国(黑色)和R.O.W.(世界其余地区,深绿色)减排量被堆叠起来,以显示全球减排总量。柱状图下面插入的表格与上面的列相对应,并给出了以kgCO2eq/MWh (kgCO2当量/MWh)为单位的标准化减排量、电源(风能、太阳能或风能/太阳能混合(W/S))以及系统的额定功率和存储容量(根据其相应的柱色进行颜色匹配);(b) 每个生命周期阶段占VRFB总碳排放的比例
Figure 3. Savings by the current operational VRFB capacity
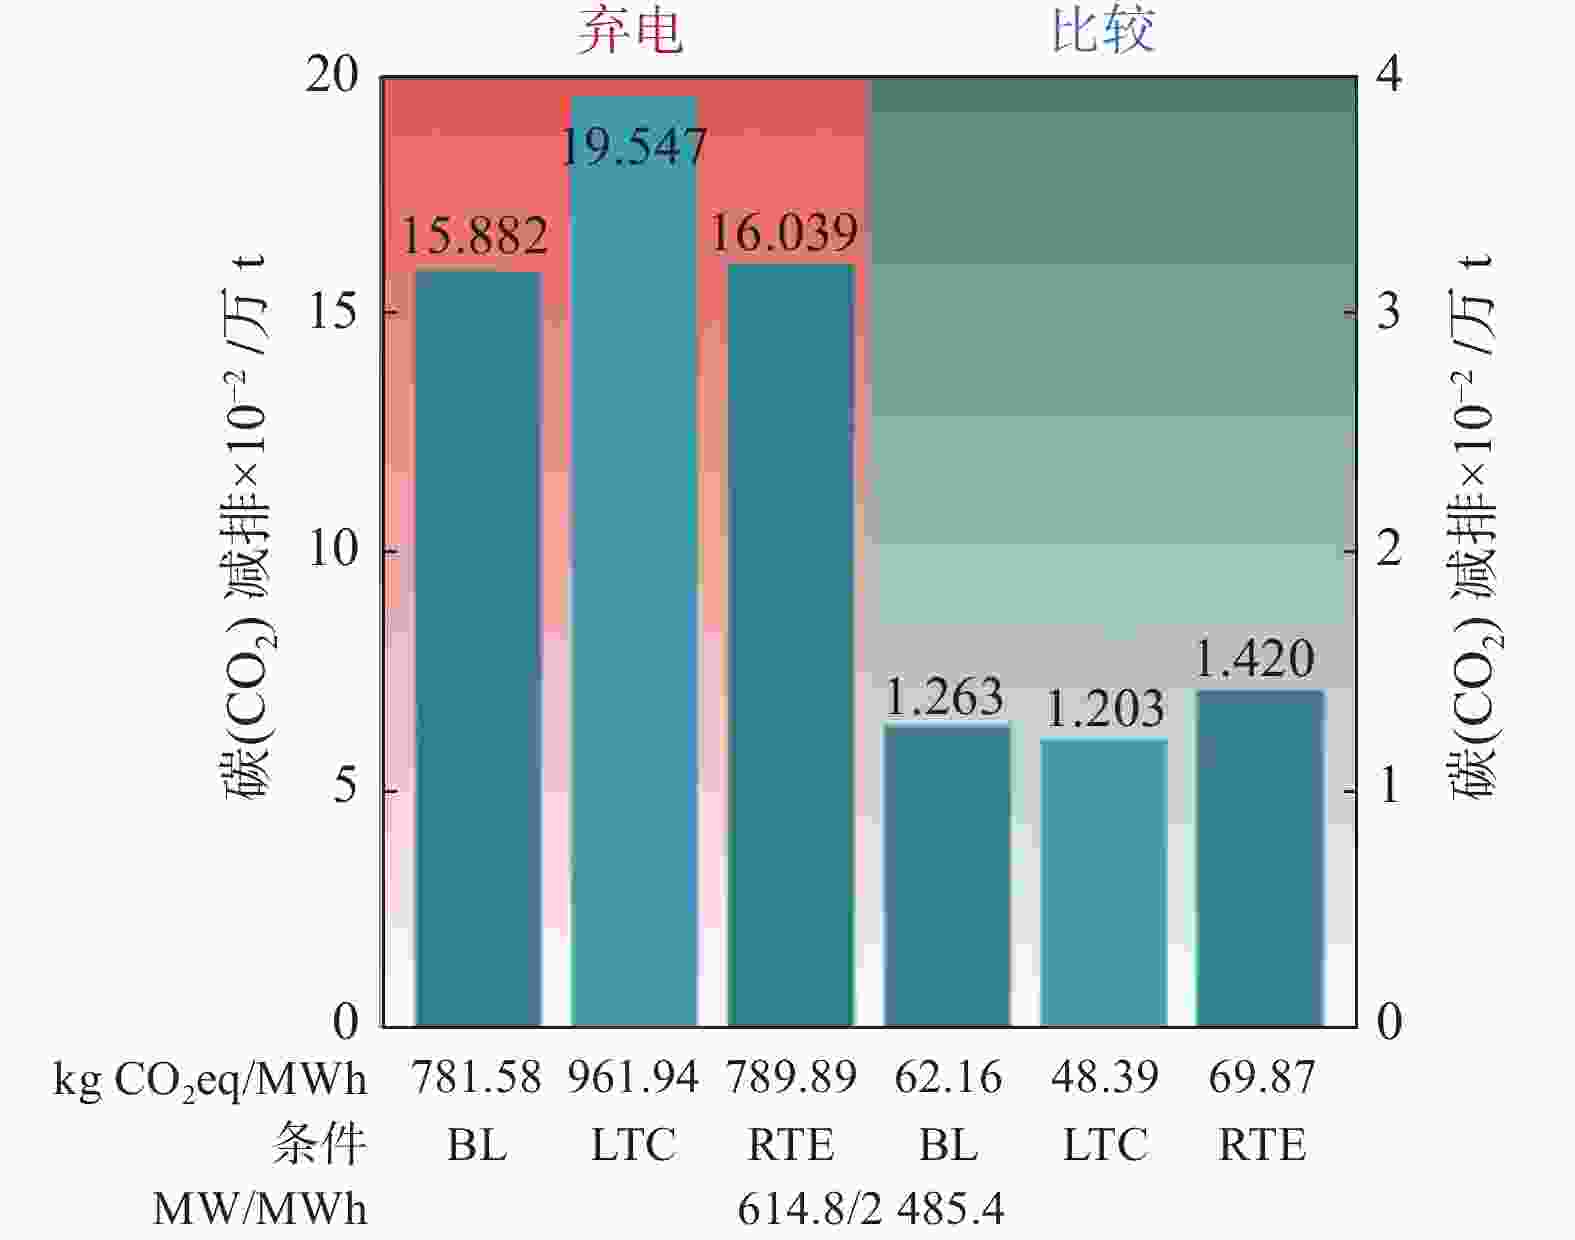
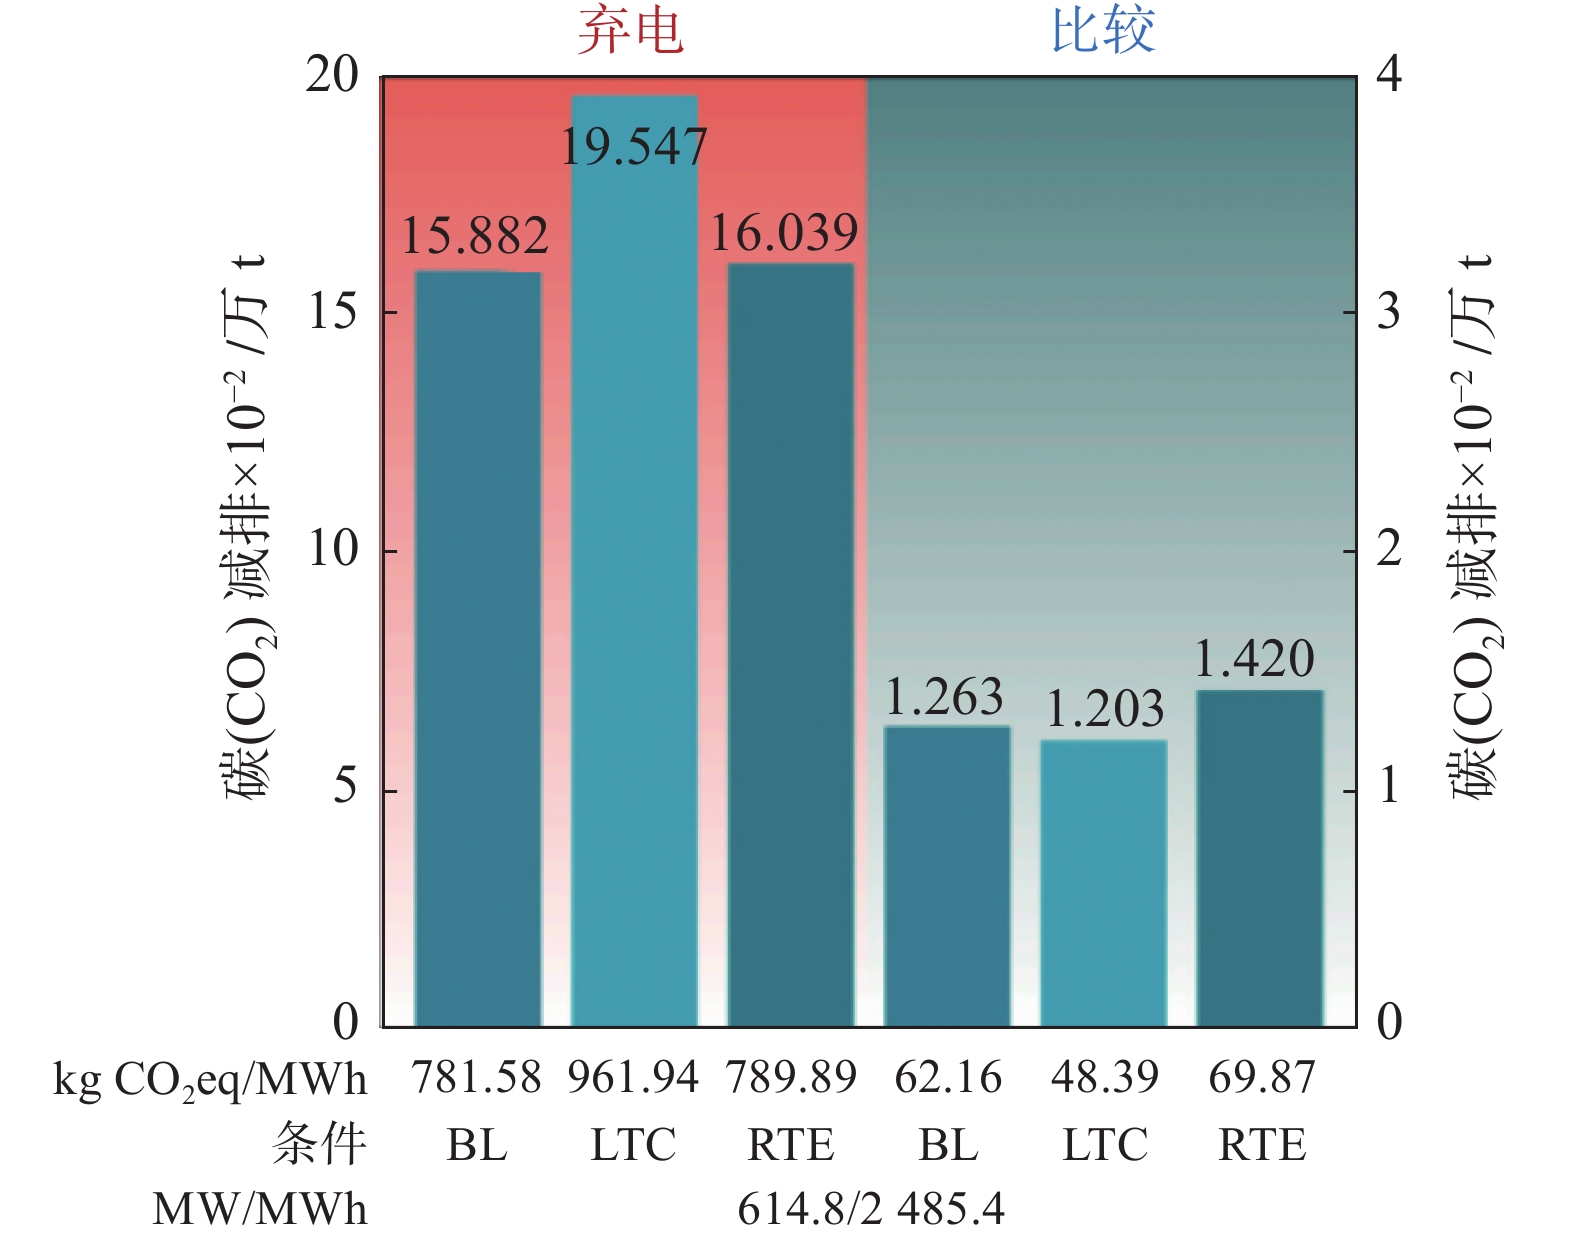
图 4 预测运行容量的VRFB碳排放减排量
VRFB预测运行容量在预期寿命内的弃电(橙色)情形和比较评估情形(绿色)下的碳减排量。柱状图下面的插入表格与上面的列相对应,并依次表示(从上到下)以 kgCO2eq/MWh(kg CO2当量/MWh)为单位的标准化减排量、条件(基准(BL)、生命周期(LTC)的增加、循环效率(RTE)提高)(以蓝色阴影区分),以及预测的运行功率和存储容量。
Figure 4. Savings by the projected VRFB operational capacity
表 1 按照当前运行的VRFB容量,弃电和比较评估情形下VRFB每年的CO2减排量
Table 1. Annualized savings by VRFBs from the curtailment and comparative assessment for current operational VRFB capacity
年减排量/万t 弃电 比较 中国 欧盟-28 世界其他地区 全球 中国 欧盟-28 世界其他地区 全球 风能 1.85 0.36 8.44 10.65 0.23 0.03 0.90 1.15 太阳能 1.58 0.31 7.23 9.13 0.16 0.02 0.63 0.81 风能/太阳能 1.72 0.34 7.85 9.90 0.21 0.02 0.80 1.03 注:按中国、欧盟28国、世界其它地区和全球地区分类,给出了风能、太阳能和风能/太阳能混合发电结合的减排量。为了展现生命周期每个阶段的比例,表中报告的一年减排量是20年生命周期中平均每年的减排量,而不是使用1年后的减排量。  下载: 导出CSV
-

计量
- 文章访问数: 383
- HTML全文浏览量: 134
- PDF下载量: 52
- 被引次数: 0